![]()
Activities
News

Soaring Weather Resources
OCGP Weather Station
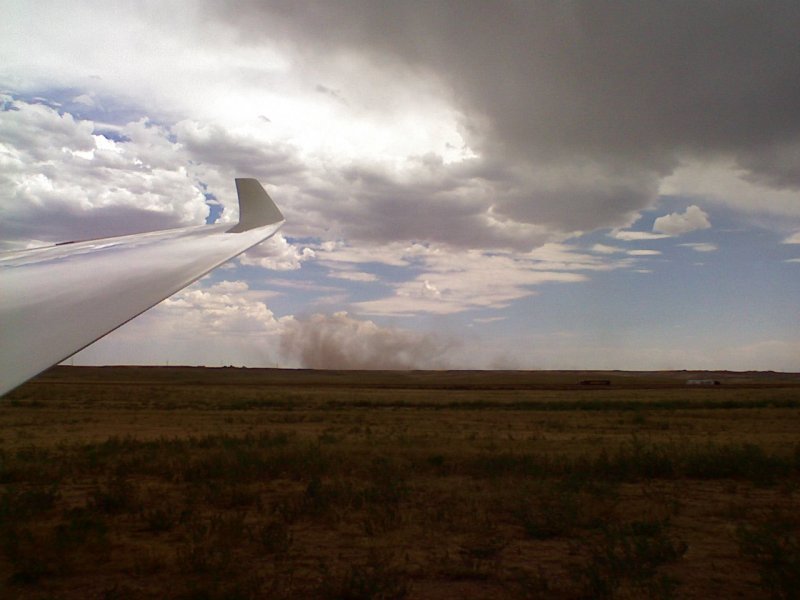
The OCGP Weather Station collects data from a weather sensor/station and a camera in an office window pointing NNW. It then generates the web pages seen on the CSA website. The weather page is updated ever 5 minutes, the camera image is updated every 15 minutes during daylight hours. From the weather page links are available to simple mobile and smartphone versions of the weather page. The are buttons to access a rolling 7-day camera image archive and a historical weather data archive.
Soaring Weather Forecasting Tools
These tools integrate sounding data over a large area and present it on a map with interactive options to display soaring parameters and in some cases integrate task planning. Many weather models are used with European models becoming more popular. However, at OCGP the GFS model (24km) which can predict up to 5 days and the HRRR (3km) which predicts current and next day work best. Especially for winds.
Free:
- Front Range RASP - Regional soaring forecast using Dr. Jacks BLIPMAP technology. Maintained by Dave L. of BFSS.
- Windy - Web/smartphone app highlighting wind forecasts. Optional layers are available (e.g. thermals). Right clicking on the map pops up local tools including a sounding for that location. For best forecasts at OCGP switch from default to GFS or HRRR model.
- Denver/Boulder soaring forecast - Issued by NWS Denver/Boulder, CO. Point report, not map based, generally found to be optimistic.
Subscription fee required:
- SkySight - Widely used interactive web/smartphone app which provides comprehensive soaring forecasts widely used in the US. The default model can predict up to 5 days, but has trouble with the local OCGP area. Select the HRRR model on day previous to flying for better OCGP results.
- XC Skies - "The original interactive soaring forecast." Many models can selected. Best to use GFS and HRRR models.
A description of the parameters presented in the interactive map based tools (RASP, SkySight,XC Sckies etc.) is available here (also stored locally Overview PDF, Detailed PDF).
Aviation Weather Center
aviationweather.gov - "The Graphical Forecasts for Aviation (GFA) web page is intended to provide the necessary aviation weather information to give users a complete picture of the weather that may impact flight in the United States... ". METARs, TAFs and other weather notifications are available from this site:
- General METAR search.
- Preloaded KFNL,KCYS METAR & TAF search.
Airspace
NOTAM Search - NOTAMs state the abnormal status of a component of the National Airspace System (NAS) – not the normal status.
- Suggested search: ”FNL, CYS”
FAA TFR Site - This is the FAA website listing TFRs, but may not be totally current. The most current information regarding TFRs is available by calling Flight Service at 1-800-992-7433 (1-800-WX-BRIEF) and then asking for announcements.
- TFR List - Sorted by state.
- TFR Map - Focused on Denver Center.
- TFR SUA Files - Generate TFR SUA files at the soaringdata.info website for use in glider flight computers.
Sectionals and chart supplements:
- FAA Sectional Chart download website.
- FAA Chart Supplement download website.
- SkyVector - interactive sectional chart website.
- soaringdata.info - GlidePlan, SeeYou and Google Earth formatted sectional and custom chart website.
WeatherCams - Primarily access to United States aviation web cameras on an FAA generate interactive map. However can also enable TFRs, color coded METARs and TAFs, weather radar and other aviation information.
Soundings - Skew-T Log-P Diagrams
Soundings can be used to determine useful soaring forecast information at one location. NOAA definitions: Skew-T Log P Diagrams - NOAA (local PDF) and Skew-T Plots (local PDF).
NOAA interactive web based sounding tool:
- NOAA rucsoundings
- NOAA rucsoundings at 4CO2, preloaded for latest data
- NOAA definitions for (local PDF): LCL, KI, LI and CAPE. iCAPE and other i* valuers appear when dry-adiabat temperature is set.
- HowTo: Walt R. 2016 Meteorological Models presentation (ESRL,pages 12-19). Short videos: Skew-T RAOB, Skew-T RAP.
Use rucsoundings to determine:
- TI (Thermal Index) - difference between measured temp and dry-adiabat temp from forecast max, at same altitude. < -3 is good.
- Max thermal height - where TI reaches zero - i.e. where dry-adiabat from forecast max temp intersects measured temp.
- First usable lift - ground temp of a dry-adiabat which intersects measured temp at ground elevation + 3000ft.
- Inversion height - where altitude stops (slows) increasing as measured temp increases ("horizontal" knee the measured temperature).
- Temp to break inversion - ground temp of a dry-adiabat where altitude re-starts increasing on the measured temp along inversion.
- Convective Cloudbase (CCL) - where saturation mixing ratio line crosses measured temp.
- Lifted Cloudbase (LCL) - indicated as a short bold horizontal line (can be same as CCL).
- Interpret CAPE, KI, LI, and winds at various points above to determine instability and thunderstorm risk.
Note: soundings can also be found on the RASP, SkySight and Windy.
1800wxbrief - Flight Service
1800wbrief is the FAA Flight Service web portal where there are several tools to get a weather briefing including a briefing based on a flight plan. To make the best use of the web portal create an account including relevant aircraft data. There are quite a few videos and an FAQ's to aid in learning how to use the portal
Phone weather briefings can be obtained at: 1-800-992-7433 (1-800-WX-BRIEF)
FAA Weather Advisory Circulars (ACs)
AC 91-92 - Pilot’s Guide to a Preflight Briefing
FAA-H-8083-28 - Aviation Weather Handbook. Aviation weather ACs were consolidated in this handbook (referenced in AC 91-92).
Dr. Jack's BLIPMAPS
NOTE: Dr. Jack is no longer maintaining these tools.
Dr. John W. (Jack) Glendening developed soaring weather forecast maps with several views of the weather, called BLIPMAPS. You can register at Dr. Jack's website here. Recreate a browser cookie here. Following are direct links to the SW viewers you can use if registered and your browser has a cookie.
RASP BLIPMAP Forecasts - Dr Jack created a software package (which others have continued to develop) for enterprising individuals to create regional forecasts directly from weather data sources. As noted in Soaring Weather Forecasting Tools above Dave L. of the Black Forest Soaring Society implemented a RASP for the Colorado Front Range.
Updated 01/28/2024
Previous page: CSA Flight Training Records
Next page: Front Range RASP